
Earlier this month we were excited to announce the launch of our brand new Publisher Dashboard service, designed specifically for scholarly publishers to give sales, marketing and editorial teams instant and actionable insight to help drive new sales, retain existing customers and track the development of publications.

The complete picture
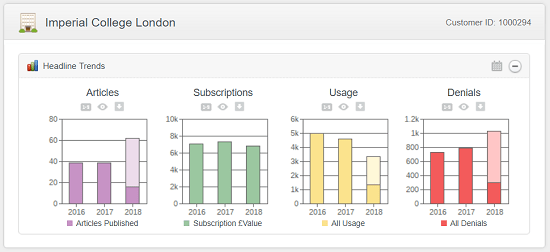
This service is the only solution in the market to offer publisher-specific dashboards which can deliver the complete customer picture – not just of institutional usage and denials data, but also of author submissions, journal subs, book sales, pay per view, individual customer and member contacts, and more.
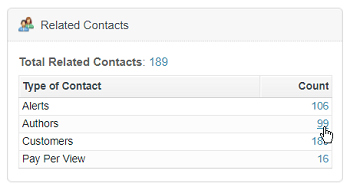
It’s also the only solution to provide full integration with GRID or Ringgold as standard – automatically linking, cleaning and deduping real-world publisher data to give truly accurate and usable results. If you choose to bring individual contacts (e.g. authors, customers, members) into the mix, they are automatically connected to their parent institutions.
Business benefits
All of this means that Publisher Dashboards provide significant insight to inform and shape business strategy and deliver financial benefits, including:
- targeting new prospects where institutions have high author submissions, access denials, or pay per view purchases
- tracking editorial processes through average times of submissions to acceptance and publication
- monitoring OA development and funder relationships
- cross-referring journal and book purchases to identify new subject/package sales opportunities
- reporting ‘at risk’ customers with high cost per download or declining usage
Wide range of functionality
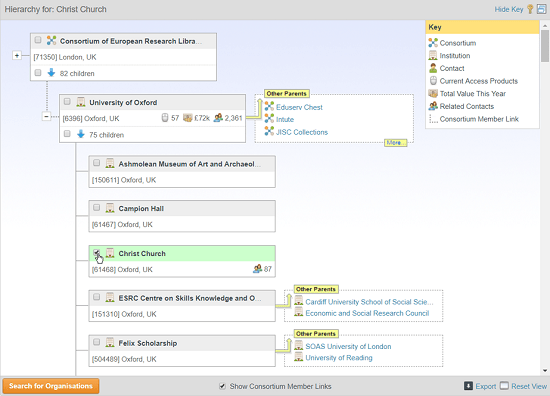
Our Publisher Dashboards are supported by a huge range of functionality, including charts, maps and tables, Venn diagrams and crosstabs, and even a ‘family tree’ view to visualize the hierarchical relationships of individual and organizational customers.
Dashboards are fully interactive, allowing users to drill right down to explore row-level detail for every customer. There are no limits on the number of different dashboards which can be configured, or on the number of staff using the system – different dashboard views can also be tailored and assigned to colleagues with differing reporting needs.
Simple and flexible
Dashboards are simple to set up and easy to use, and there’s nothing to install – the service is fully web-based, and works with all modern browsers on PC, Mac and iPad. Publishers can choose to include as many or as few data sources as they wish – we already handle a huge range of books and journals data for over 20 different publishers worldwide, including subscriptions, sales, usage, denials, author submissions, members, pay per view purchases, e-alert signups and more. The system also supports many data transfer standards such as SUSHI for COUNTER reports, and the ScholarOne API for author submissions data.
See it for yourself!
If you’d like to find out more about the benefits that tailored Publisher Dashboards can bring to your organization, then please do get in touch!
