
A key feature of our new Publisher Dashboard service is that it delivers a complete picture of customer interaction, from article submissions through to journal usage and denials, so the insights it offers are relevant across the whole publishing organization. Here we focus on how it can help inform editorial policy.
Improving editorial workflow
Understanding what percentage of submitted articles make it as far as publication is essential in developing a successful content management strategy.
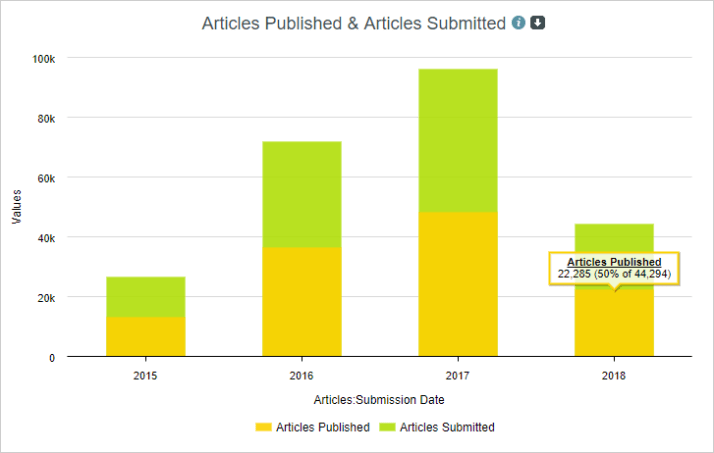
And, because cross-journal reports can be broken down into smaller segments, it’s easy to look at the story behind the overall trends, such as how particular subjects are performing in relation to other subjects.

The efficiency of the editorial process itself can also be measured, by tracking average times from submission to acceptance and publication.

Finding authors and reviewers
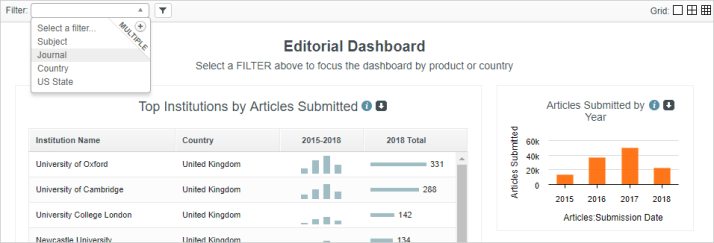
Because we link individual authors and reviewers to their institutions, editorial activity can be reported at an institutional level. Ranking institutions by their submissions can suggest institutions to target when looking for new authors or reviewers.

And this information can be filtered by journal or subject for a more specific focus.
Measuring impact
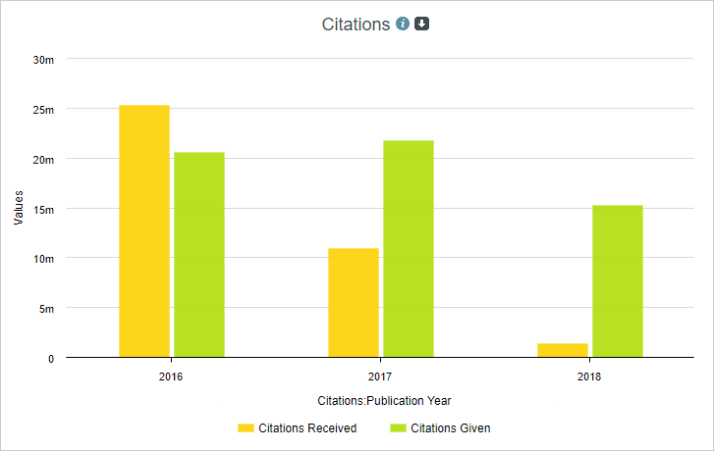
While looking at the volume of submissions to a journal is one indication of its reputation amongst scholars, the most common measure of impact is the number of times its articles are cited.
Tracking open access
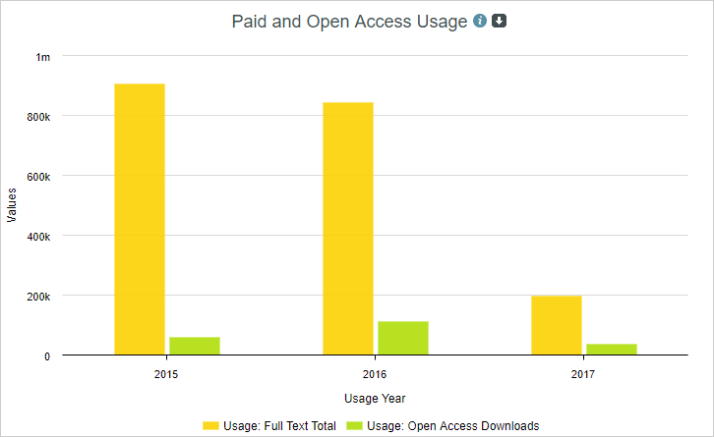
With the recent European Plan S initiative, open access is an area of increasing focus for many publishers. Tracking applications to make articles open access is one way to gauge the effect of such developments on your own journals.
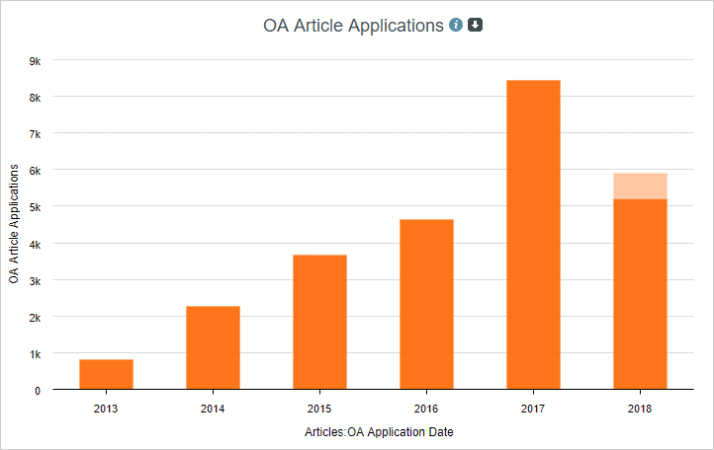
And you can also look at the results further along the publishing process, by charting usage of open access articles against usage of paid articles.
We hope the above use cases give you a flavour of what our Publisher Dashboards can offer. If you’d like to find out more about how we can help your editorial team, then please do get in touch!
