
When developing our publisher dashboard functionality, our focus has been on providing the complete picture and not just a few parts of the puzzle. This enables publishers to target new prospects, retain existing customers, understand the performance of their content and identify key trends.
Five main data types make up the foundations of a comprehensive publisher dashboard:
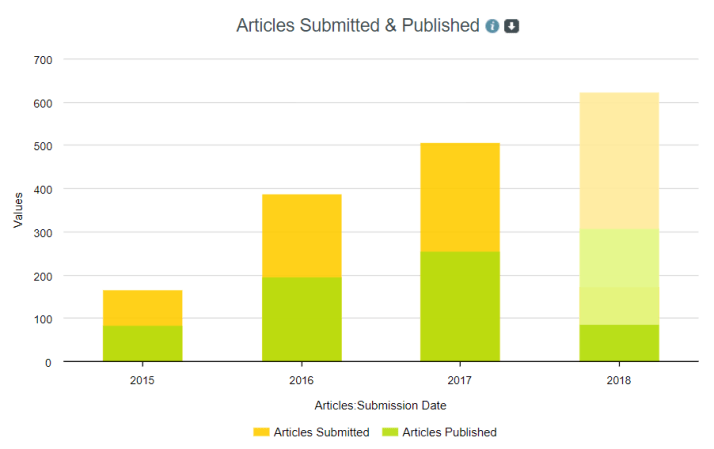
Author submissions: Quick visualisation of submissions, rejections, average time to publication, funding and OA data provides Editorial staff with a comprehensive picture of published content. Finding institutions with no subscriptions to a journal, then analysing which of these have high author submissions to that journal, identifies a target set of prospective customers for sales staff.
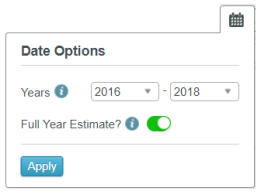
Sales: Comparing sales year-on-year, with full-year estimates, enables easy tracking against sales targets.
Subscriptions: Breaking down current subscriptions by subject highlights package upsell opportunities.

Usage: Charting usage trends picks up ‘at risk’ institutions in time for campaigns to address declining usage before subscriptions become due for renewal. It can also highlight how publications are performing and which packages / products have been successful.

Denials: High numbers of access denials give hard evidence of significant demand for a journal, supporting the selling of new subscriptions to non-subscribing institutions.

If you don’t have all these data types, don’t despair! You can still create insightful dashboards – and we may be able to help you fill in the missing pieces, for example by inferring CPD from subscriptions and usage data.
The examples above illustrate only a fraction of the ways in which your customer data can be used and presented, and we can offer help in creating dashboards tailored to your users’ needs – just get in touch to discuss your requirements.
