
We’ve been busy adding a number of handy new features to our MasterVision service over the last few months. Here’s a quick round-up for anyone who hasn’t yet had the chance to try them out.
Year-to-date comparisons in analytics
A new ‘Show YTD’ chart option displays stacked bars with year-to-date and full-year figures, so that in your year-on-year comparisons you can see how the current year is measuring up against the same point in previous years. This can highlight any areas where progress is not as expected, allowing you to take early action.

Search results filtering
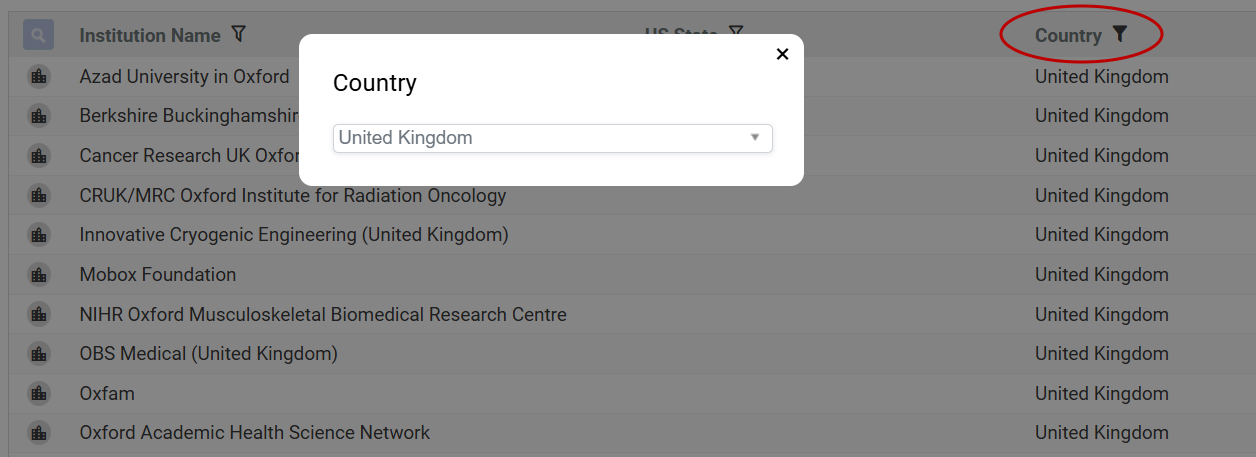
The direct filtering of search results that we announced a few months ago for our PaperStack service has been extended to MasterVision. This includes all our standard search widgets and enables you to refine your search results without going back to the original search, making it easy to focus in on the exact records you need.
Improved dashboard notes
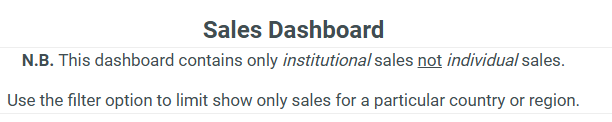
With MasterVision you can set up as many custom dashboards as you need, providing the different departments across your organization with instant insights. Because the users of these dashboards may not be familiar with the detail of the data on which they’re based, explanatory notes can be very helpful, covering either the dashboard as a whole or individual charts. You can now add formatting and multiple lines to these notes to improve readability.
Date-stamped exports
PDF downloads have been updated to include the date of the latest MasterVision build – a simple but useful change enabling you to see at a glance how up to date the downloaded charts are.

Simplified list uploads
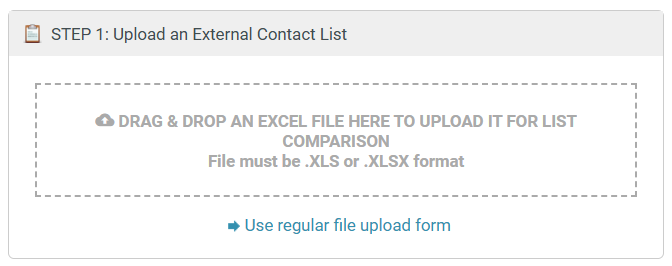
For speedier uploads, you can now drag and drop spreadsheet files into MasterVision, making it even easier to match external contact lists against your current database.
These enhancements are all designed to make MasterVision even quicker and easier to use – we hope you enjoy them!
