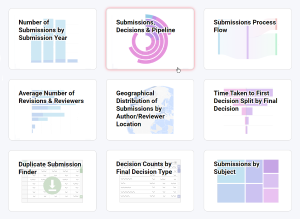
Users of our PaperStack service will have noticed that the report tiles on the home page have had a makeover. We love the beautiful design our technical team have come up with and want to share it with you in this month’s blog.

The number of reports available has grown significantly since we first launched PaperStack back in 2019, and the new home page is designed to make it easier to locate the one you want. The new graphics differentiate between the different types of chart more clearly, as well as more accurately reflecting the appearance of the actual reports – so, even if you can’t remember what the chart is called but can visualise what it looks like, you should be able to find it!
To discover more about the insights all these charts can give your editorial team, and how PaperStack can help maximise the efficiency of your publishing programme, please get in touch to request a demo.

