
The whole purpose of metrics and charts is to help answer two fundamental questions: “how are we doing?” and “what should we do next?”. For journal publishers, there are several different ‘vital signs’ to track over time, and real insight only comes from looking at them alongside each other, not just in isolation.
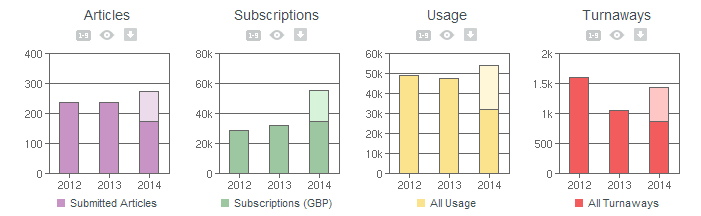
Article submissions
The volume of submissions is a key indicator of a journal’s reputation and relevance to current research trends. When tracked alongside other key metrics, you can turn information into insight: for example, healthy subscriptions but declining submissions may indicate trouble ahead.
Subscription revenue
Open Access may be on the rise, but subscriptions still remain the cornerstone of the journals business for many publishers, and it’s essential to keep careful track of which journals and territories are seeing revenues rise or fall over time.
Usage
Tracking usage trends is just as important. High usage may indicate a safe renewal, and low usage may indicate an ‘at risk’ customer… and you can be sure that your library customers will be looking at those usage figures themselves with equal scrutiny!
Denials
“Access denied” data can be a gold mine of useful information, providing excellent leads for growing subscription revenues where there is unmet demand. We’ve already helped many of our clients to convert denials data into substantial new sales, so it definitely deserves to be an essential metric.
Being able to see how all of these metrics are changing over time – by customer, by journal, and by territory – is vital to the strategy of any journals business. And it’s just as important to see them side-by-side, whether for securing renewals, driving new submissions, or converting denials into sales. Better information always produces better results.
