
The rejected article tracking module of DataSalon’s PaperStack service was added to enable editorial staff to discover the subsequent fate of the articles rejected by their journals – whether they were later published elsewhere and, if so, in what journal and with which publisher. But how valuable are the articles lost in this way? A straightforward way of assessing this is by taking the number of citations as an indicator of the quality of the research – so we’ve now added a new report to PaperStack that allows you to view and analyse citation counts for your rejected articles.
You can change the report view to see citations from three different frames of reference:
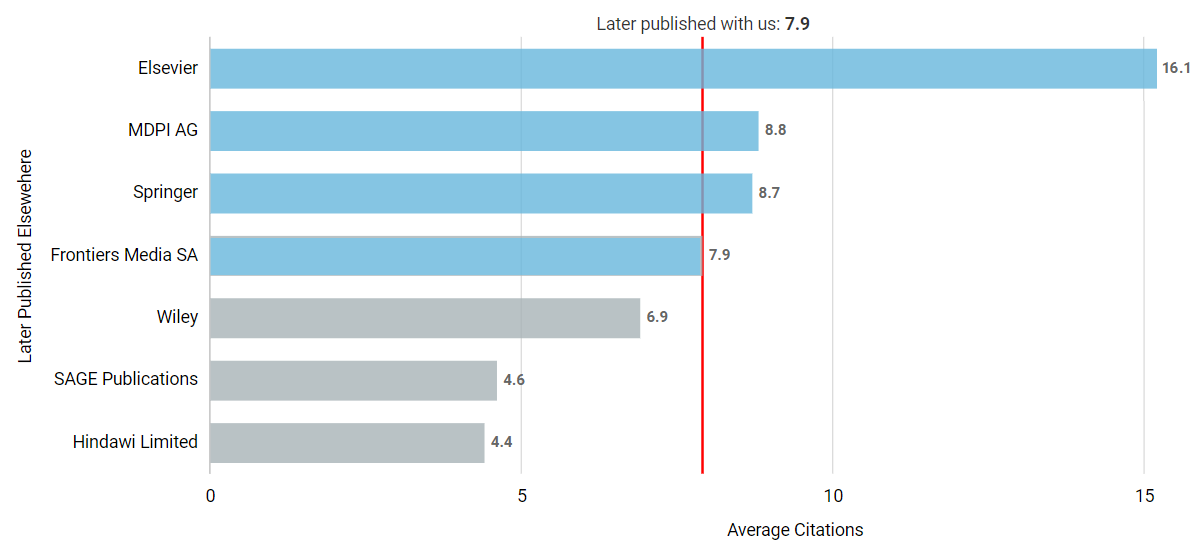
- Publishers: which publishers are getting the most overall citations from publishing your rejected articles?
- Journals: which journals belonging to other publishers are getting the most citations from publishing your rejected articles?
- Our journals: which of your journals are losing out on the most citations due to rejecting articles which are later published elsewhere?
As with all PaperStack reports, this one is fully interactive, so that you can click any bar to navigate down through the levels – a list of journals with their article and citation counts, a list of the articles from each journal, and finally details of each individual article.
The default view is of average number of citations: this allows for fairer comparison within the set of journals or subjects selected using the report filters, since expected numbers of citations will vary according to the field of research. But it is also possible to display total numbers – for example, you may want to drill down to find particularly highly cited papers and view the details of the review process in the article timeline.
Whether you’re concerned with averages or totals, the red line on the report allows easy benchmarking against the average or total number of citations for rejected articles that were later published within your own portfolio rather than by other publishers.
Since citation counts take a while to build up, you can limit the view to a particular year rather than seeing the figures for all years. And because a few outliers with large numbers of citations can skew the data, a ‘minimum articles’ dropdown allows you to set an appropriate baseline for comparing averages, by excluding from the chart publishers or journals with fewer articles.
This new chart adds a valuable additional component to the overall picture that PaperStack paints of your peer review process. To find out more, please get in touch to request a demo.
