
This month we’d like to show you the beautiful dashboards which have recently been added to DataSalon’s PaperStack service. Of course, these visualisations have much more to offer than their attractive appearance, so let’s also look at the benefits of using them.
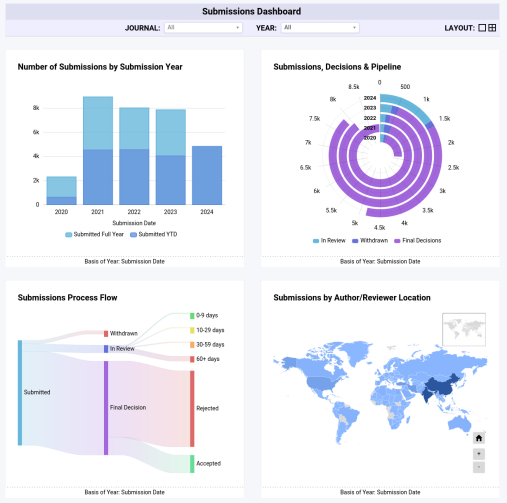
Headline measures: Each dashboard brings together key measures relating to a particular part of the submissions process, giving a comprehensive summary which allows you to see trends, track progress, and monitor performance.
Efficiency: Being able to see key information easily and quickly saves the time of editorial staff, allowing them to concentrate on reviewing that information and making decisions based on the insights offered.
Real-time tracking: Because the dashboards are simple to access and quick to load, it’s easy to keep a regular eye on performance – so that you can take timely action where necessary to get back on track. PaperStack data is usually updated weekly, and the data behind the dashboard is refreshed with this latest dataset each time the dashboard is viewed, so that you’re always basing your decisions on up-to-date information.
Flexibility: Business executives can view PDF downloads summarising the data for all journals, while filtering at a dashboard level allows editorial staff to view data for their own journal or journals. And individual charts within the dashboard retain their individual configuration and breakdown options where appropriate, so that any member of staff can personalise the dashboard according to their own requirements.
Completeness: We understand that a dashboard may often be a useful starting point for further analysis work, so the charts within the dashboards are fully interactive and clickable, enabling you to delve into the details behind the overall picture.
To understand more about how PaperStack and its dashboards can help your editorial team make sound, data-driven decisions, please get in touch to request a demo.
