
In the current difficult economic times, marketing activities need to be carefully focused, to make the most of limited time and budgets. We’ve been helping a number of our clients to use the data they load to MasterVision to identify their strongest sales opportunities for new subscriptions.
The basic principle is simple: where an institution doesn’t have a subscription to a particular journal, we look for other activity suggesting that the journal would be used were the institution to subscribe to it. This might be researchers at the institution submitting articles to the journal, paying to access individual articles, signing up to alert services, or being denied access to an article. This may sound straightforward, but there’s a lot involved in bringing all the information together.
Matching up institutions: Variations in name forms, errors in data entry and differing data structures make it difficult to collect all the data relating to the same institution into a single clean, standardised record. Fortunately, our set of tools for automatically matching against a reference database (GRID or Ringgold), and then linking up records using this information and any other available identifiers, means institutional records are already presented this way in MasterVision.
Associating individuals with institutions: Much of the activity mentioned is at the individual rather than the institutional level. We therefore need to be able to associate individuals with the institutions to which they are affiliated. Again, our automatching tools come into play – even for data where the individual’s affiliation isn’t specifically stated, we may be able to infer it from other information such as email address.
Standardising journal names: Titles may need to be tidied up so that they match across data sources, or journal codes may need to be mapped to full titles. Many publishers bundle their titles together into packages or collections, and these need to be unrolled in order to understand exactly which journals an institution already has access to.
Identifying relevant data: How are current subscriptions identified? Do separate sources (e.g. print and electronic subscriptions) need to be amalgamated? What date information can be used to identify recent activity? The answers vary, so reports are custom-made, based on a full understanding of the client’s data.
Presenting the result: To represent this multifaceted data in a two-dimensional way, we’ve come up with a system of scoring the sales opportunities according to the amount of activity relating to each journal. In its simplest form, this involves assigning one point for each article submitted, each paid-for view, each alert-sign-up and each turnaway. However, these points could be weighted to assign more importance to particular types of activity.
Scores are represented in a matrix, with institutions to target down the side and journals across the top. The higher the score for a particular journal, the stronger the sales opportunity.

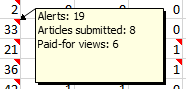
While it’s useful to see an overall picture, sales staff will also need to understand the story behind the total. So we’ve added a note to each score, showing it broken down into its component figures.
These reports offer tightly targeted lists for sales and marketing departments to work from, allowing them to offer relevant deals to new customers and identify opportunities for upselling to existing customers.
